
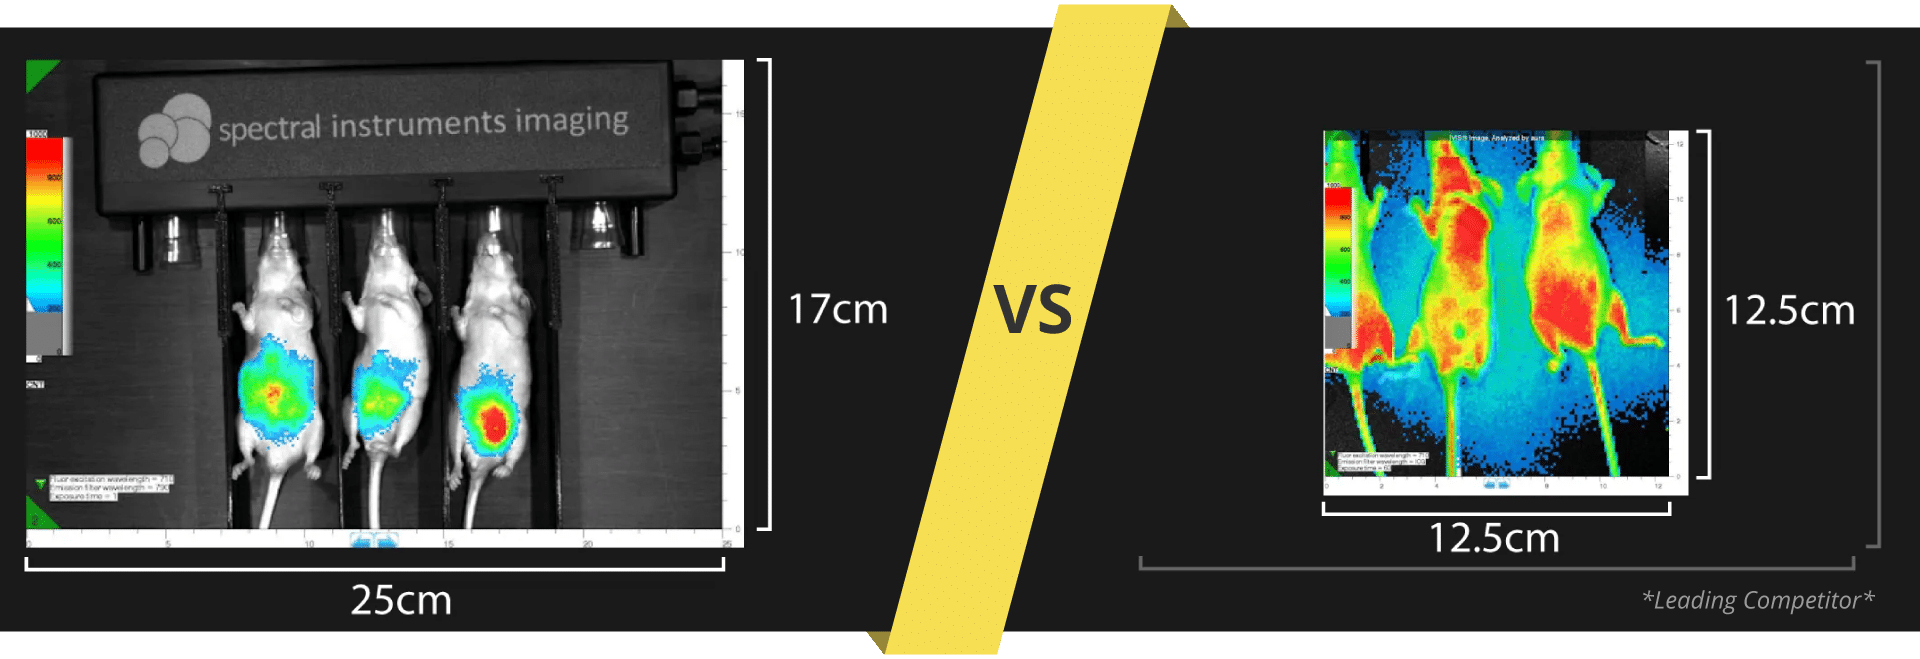


Ami HTX FoV 25x17cm
Allows you to easily image 5 mice in a single exposure


Leading Competitor FOV 10x10cm


Multi Modality Coregistration
Quantitative 3D Optical Imaging


Spectral customer support is excellent. Whenever we reach out to them, they get back to us quickly

We have used our Ami-X intensively for the past four years and have been extremely pleased with the sensitivity and reliability of this instrument, both for NIR fluorescence and bioluminescence capture. Operation is very simple and the system needs almost no maintenance at all. On top of this, technical support is easy to reach and quick to reply with solutions for general use and technical questions. The Aura software is very simple to learn and having unlimited free copies of this program available for all our computers is an enormous advantage for image analysis. In fact, the system is so robust and easy to operate that we use it not only for research but also for teaching in vivo imaging methods in our graduate courses.

Our Ami has been an essential instrument in our lab for a few years now and has always worked reliably, especially during many periods of intensive usage. The Aura software is very user-friendly and intuitive to operate. Communicating with technical support is always a quick and pleasant affair and they have been incredibly forthcoming in replacing some minor lost parts, so that we could continue using our Ami without delay.

We were so pleased with the instrument’s performance and SII’s support within the very first year of use that we committed to a replacement of our entire suite of older instruments with SII products.
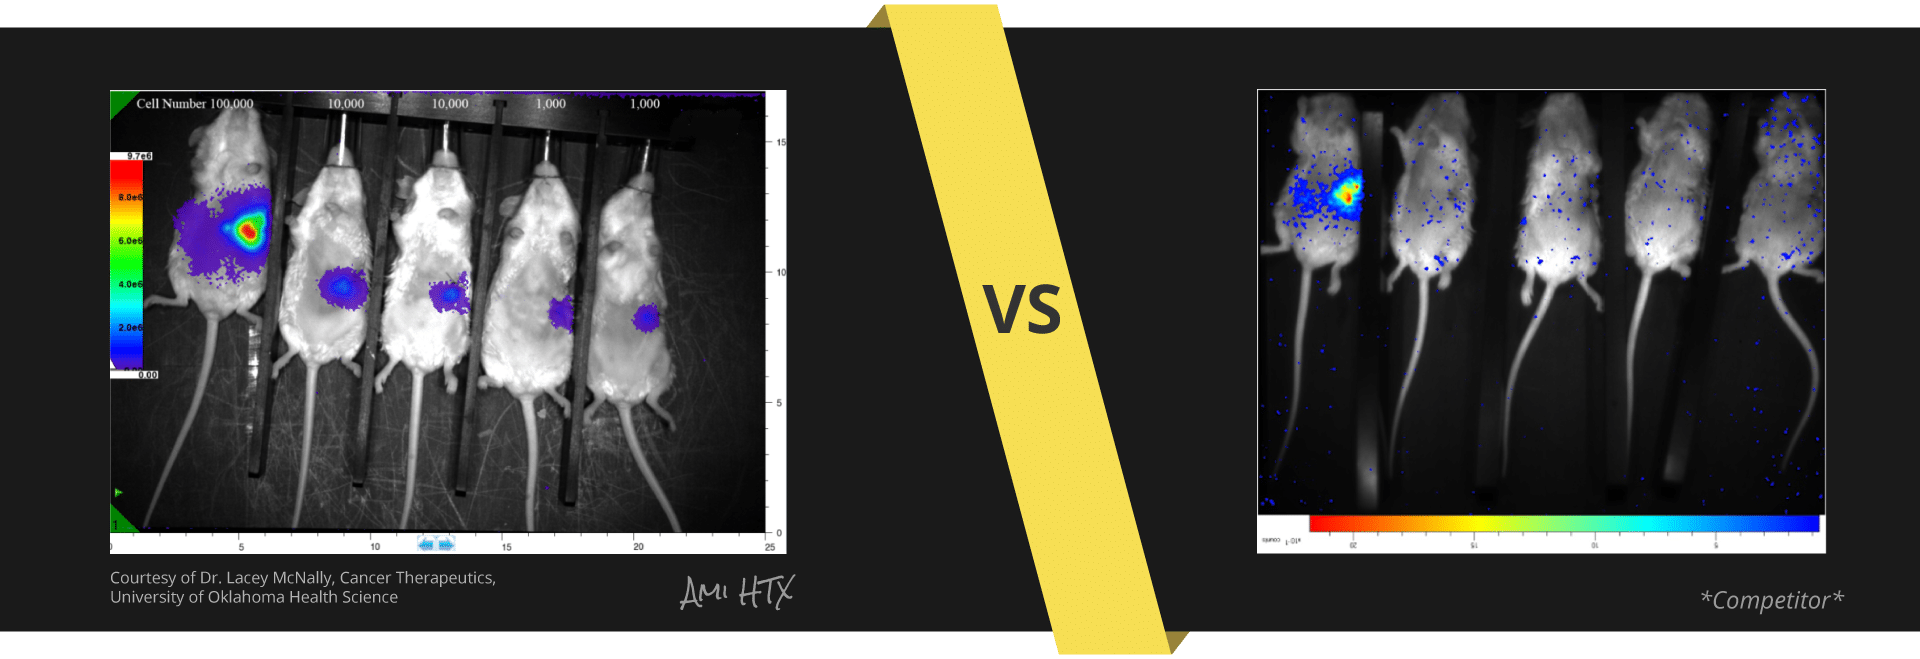
The LED based illumination meant that there was nearly a 90X more light incident on the surface of the specimen versus traditional white lights used by other manufacturers which translates to earlier detection – sometimes weeks ahead – saving researchers time and money. It also dramatically improved the utilization of the imaging core.
SII has a single-minded focus on building the best optical imaging instruments for bioluminescence and fluorescence. The entire company – management, engineers, sales team and support is aligned around that central focus.
This has meant many good things for us as a customer – where the innovation continues non-stop. We are already seeing many new features in software and hardware that leave us very optimistic about the future.

The Ami HT system is pretty user friendly. The system was clearly designed to image mice in an efficient and safe way
"We really like the SII Lago imaging instrument because it has several improvements as compared to our previous IVIS® instrument. The second adapter with 10 nosepieces allows us to image up to 10 mice at once, which saves us a lot of time when imaging mice. Additionally, the software is very user-friendly and easy to run. Nice features that we appreciate are the white light inside the instrument that is very helpful for positioning the mice. Also, the button that automatically opens the door of the instrument is helpful. Finally, we noticed that the instrument reaches the temperature in a very short time allowing us to begin imaging pretty much right away and this again saves us a lot of time"

“The support from Spectral Instruments has been excellent. The only issue that we have had with our two LagoX machines was self-inflicted. Aggressive firewall and anti-virus software that we installed on the computer resulted in a camera initialization issue. Spectral Instruments responded immediately and was on site within 48 hours. They worked with us to identify and correct the issue. It is refreshing to work with a company that is personally engaged and takes pride in the quality and support of their product.”

I have been extremely pleased with SII. Bo Nelson and the team has been outstanding with helping me with filter selections and filter exchanges based upon fluorophore requirements, ensuring the instrument is operating to specifications, with new software updates and any problems, albeit rare, we are having with our Ami. The system is super robust and easy to train users. Another huge benefit is the software is free, allowing me to refer to our users to SII website and thereby allowing them to analyze the data on their own PCs saving time and money.

We are very happy with the Lago and LagoX systems. Great customer service too.

[I am] impressed with its robustness and its abilities to detect a wide range of labels and sensitivity of detection.

Due to the frustrating customer support experiences related to our Perkin Elmer's IVIS® instrument, we decided to give the Lago X a shot. As a core laboratory, we offer it to multiple research groups. Our users transition from IVIS® to Lago was seamless. They are pleased by the faster cooling of the Lago camera, the higher animal capacity of the imaging chamber, user friendliness of the [free] Aura software (additional IVIS® desktop analysis software copies must be paid for)
We have a great relationship with Bo, Andrew and the SI team. Getting hardware or software support from them is just so easy!

Having the ability to easily image up to 10 animals at a time has been such a time saving bonus! I can get my data collected twice as fast which allows me more time for data analysis and coffee! The Lago is very intuitive and so easy to use. I have been using the system for over a year now and have not yet ran across any type of malfunction issue, my previous equipment would require constant troubleshooting.
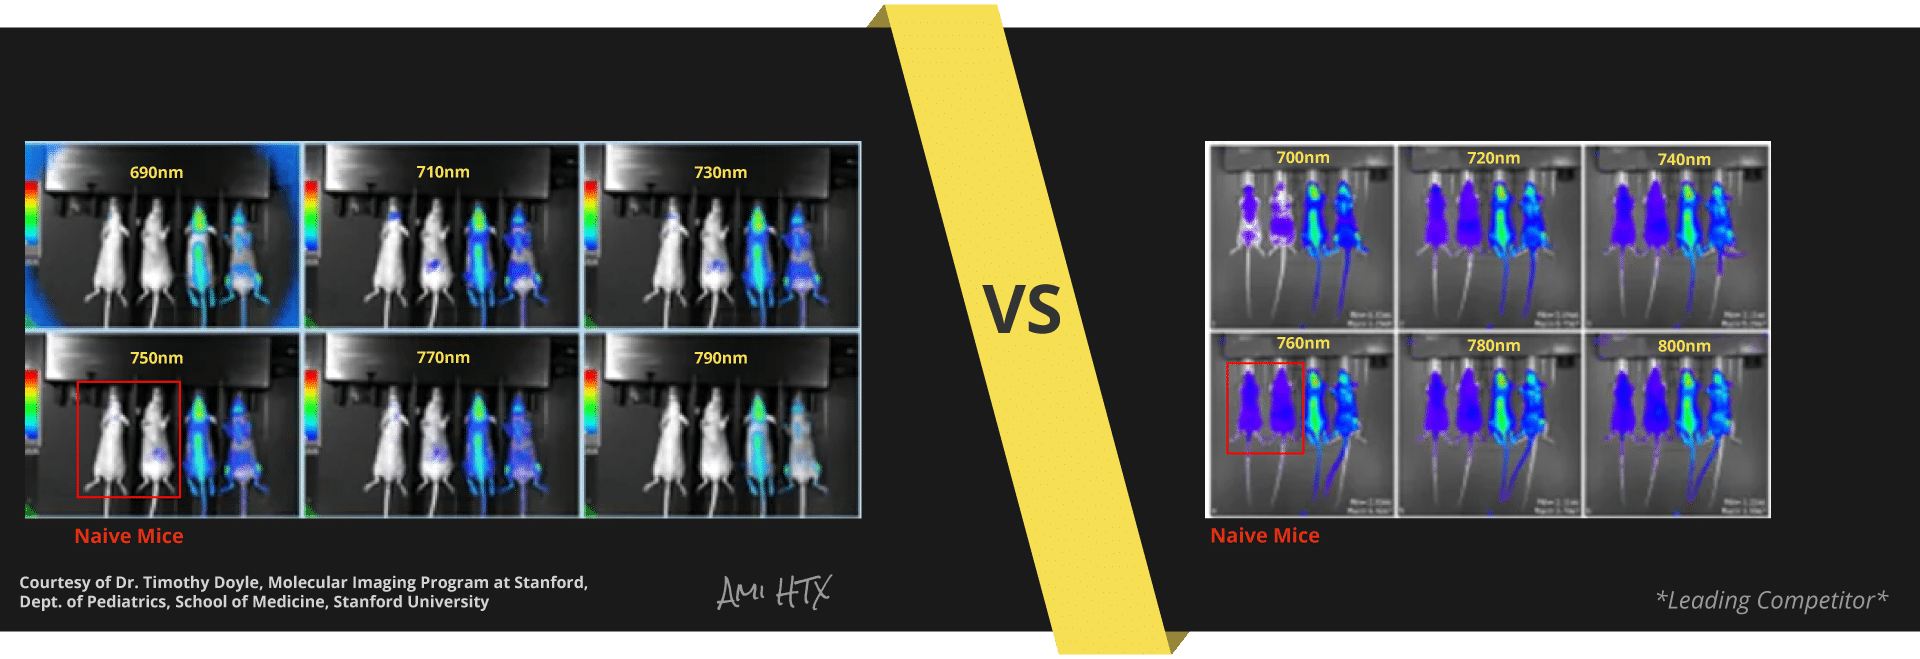
In our laboratory, we have found the AMI imaging system to provide reproducible BLI imaging data in the context of orthotopic pancreatic and ovarian tumors in mice. As these tumor types are located deeply within the mouse, it was essential to have a system that had high sensitivity. One aspect of the AMI that we find to be highly important is the reproducibility of the images including that the signal detected from each mouse is independent of the relative order of the mouse within the system, i.e. mouse 1 has the same signal regardless of if it is in the 1, 2, 3, 4, or 5 position within the mouse holder. Additionally, we have found the NIR fluorescence to be of high sensitivity with the ability to differentiate signals at 680nm, 715nm, 750nm, and 800nm. Perhaps, the most important aspect of our experience with Spectral Instruments Imaging has been that they are very receptive to aiding the users and provide exceptional support even well after our instrument purchase

I have had over 20 years experience utilizing bioluminescence imaging in mouse models of cancer in both industry and academic settings. This technology is essential for the work performed by my lab and with our collaborators. Much of our work is done with orthotopic and metastatic tumor models, but we also use it for luciferase-enabled genetically engineered mouse models. We use bioluminescence imaging to evaluate biologic aspects of tumor progression and metastasis as well as response to experimental therapeutics. For the past 5 years, we have exclusively used the Spectral Instruments AMI HTX system having switched from our IVIS® 100. We have been impressed with the relative performance of the AMI HTX system, from its rapid startup, stability, sensitivity and the ease of using Aura software, which is freely available to my collaborators facilitating our studies. Spectral Instruments has been a pleasure to work with over the years responding rapidly to any questions that emerge. I am highly recommending this system to anyone who uses this technology.

We have never experienced such an excellent customer relationship with any other vendor and are truly appreciative.
Our core runs the Ami users all enjoy the machine. The software update with easy mode has been great for new users to have a guided trial for different tests. As the trainer for the past few months and managing this machine, I have collected a lot of feedback. We are able to produce clear images with greater ease than the IVIS® system. Having a centralized mechanism for x-ray, fluorescence, and bioluminescence has been a great tool for all users. Using the Ami-HTX, we have been able to use a hypoxia-targeting dye to confirm the hypoxia status of two cancer cell lines

I would definitely say I prefer the Ami HT to the Xenogen IVIS®. The software is intuitive, the nose cone setup is more flexible, and the resolution is better, but by far the best feature is how quickly the camera sensor cools down. No more waiting around for ages if you forget to pre-cool the instrument!